Insights
Fully Integrated Data Analytics Solution on the Cloud for Consumer Goods
Clear, crisp, and actionable intelligence delivered to you in real-time.
Keep Data at the Center of Your RTM outcome Business Strategy.
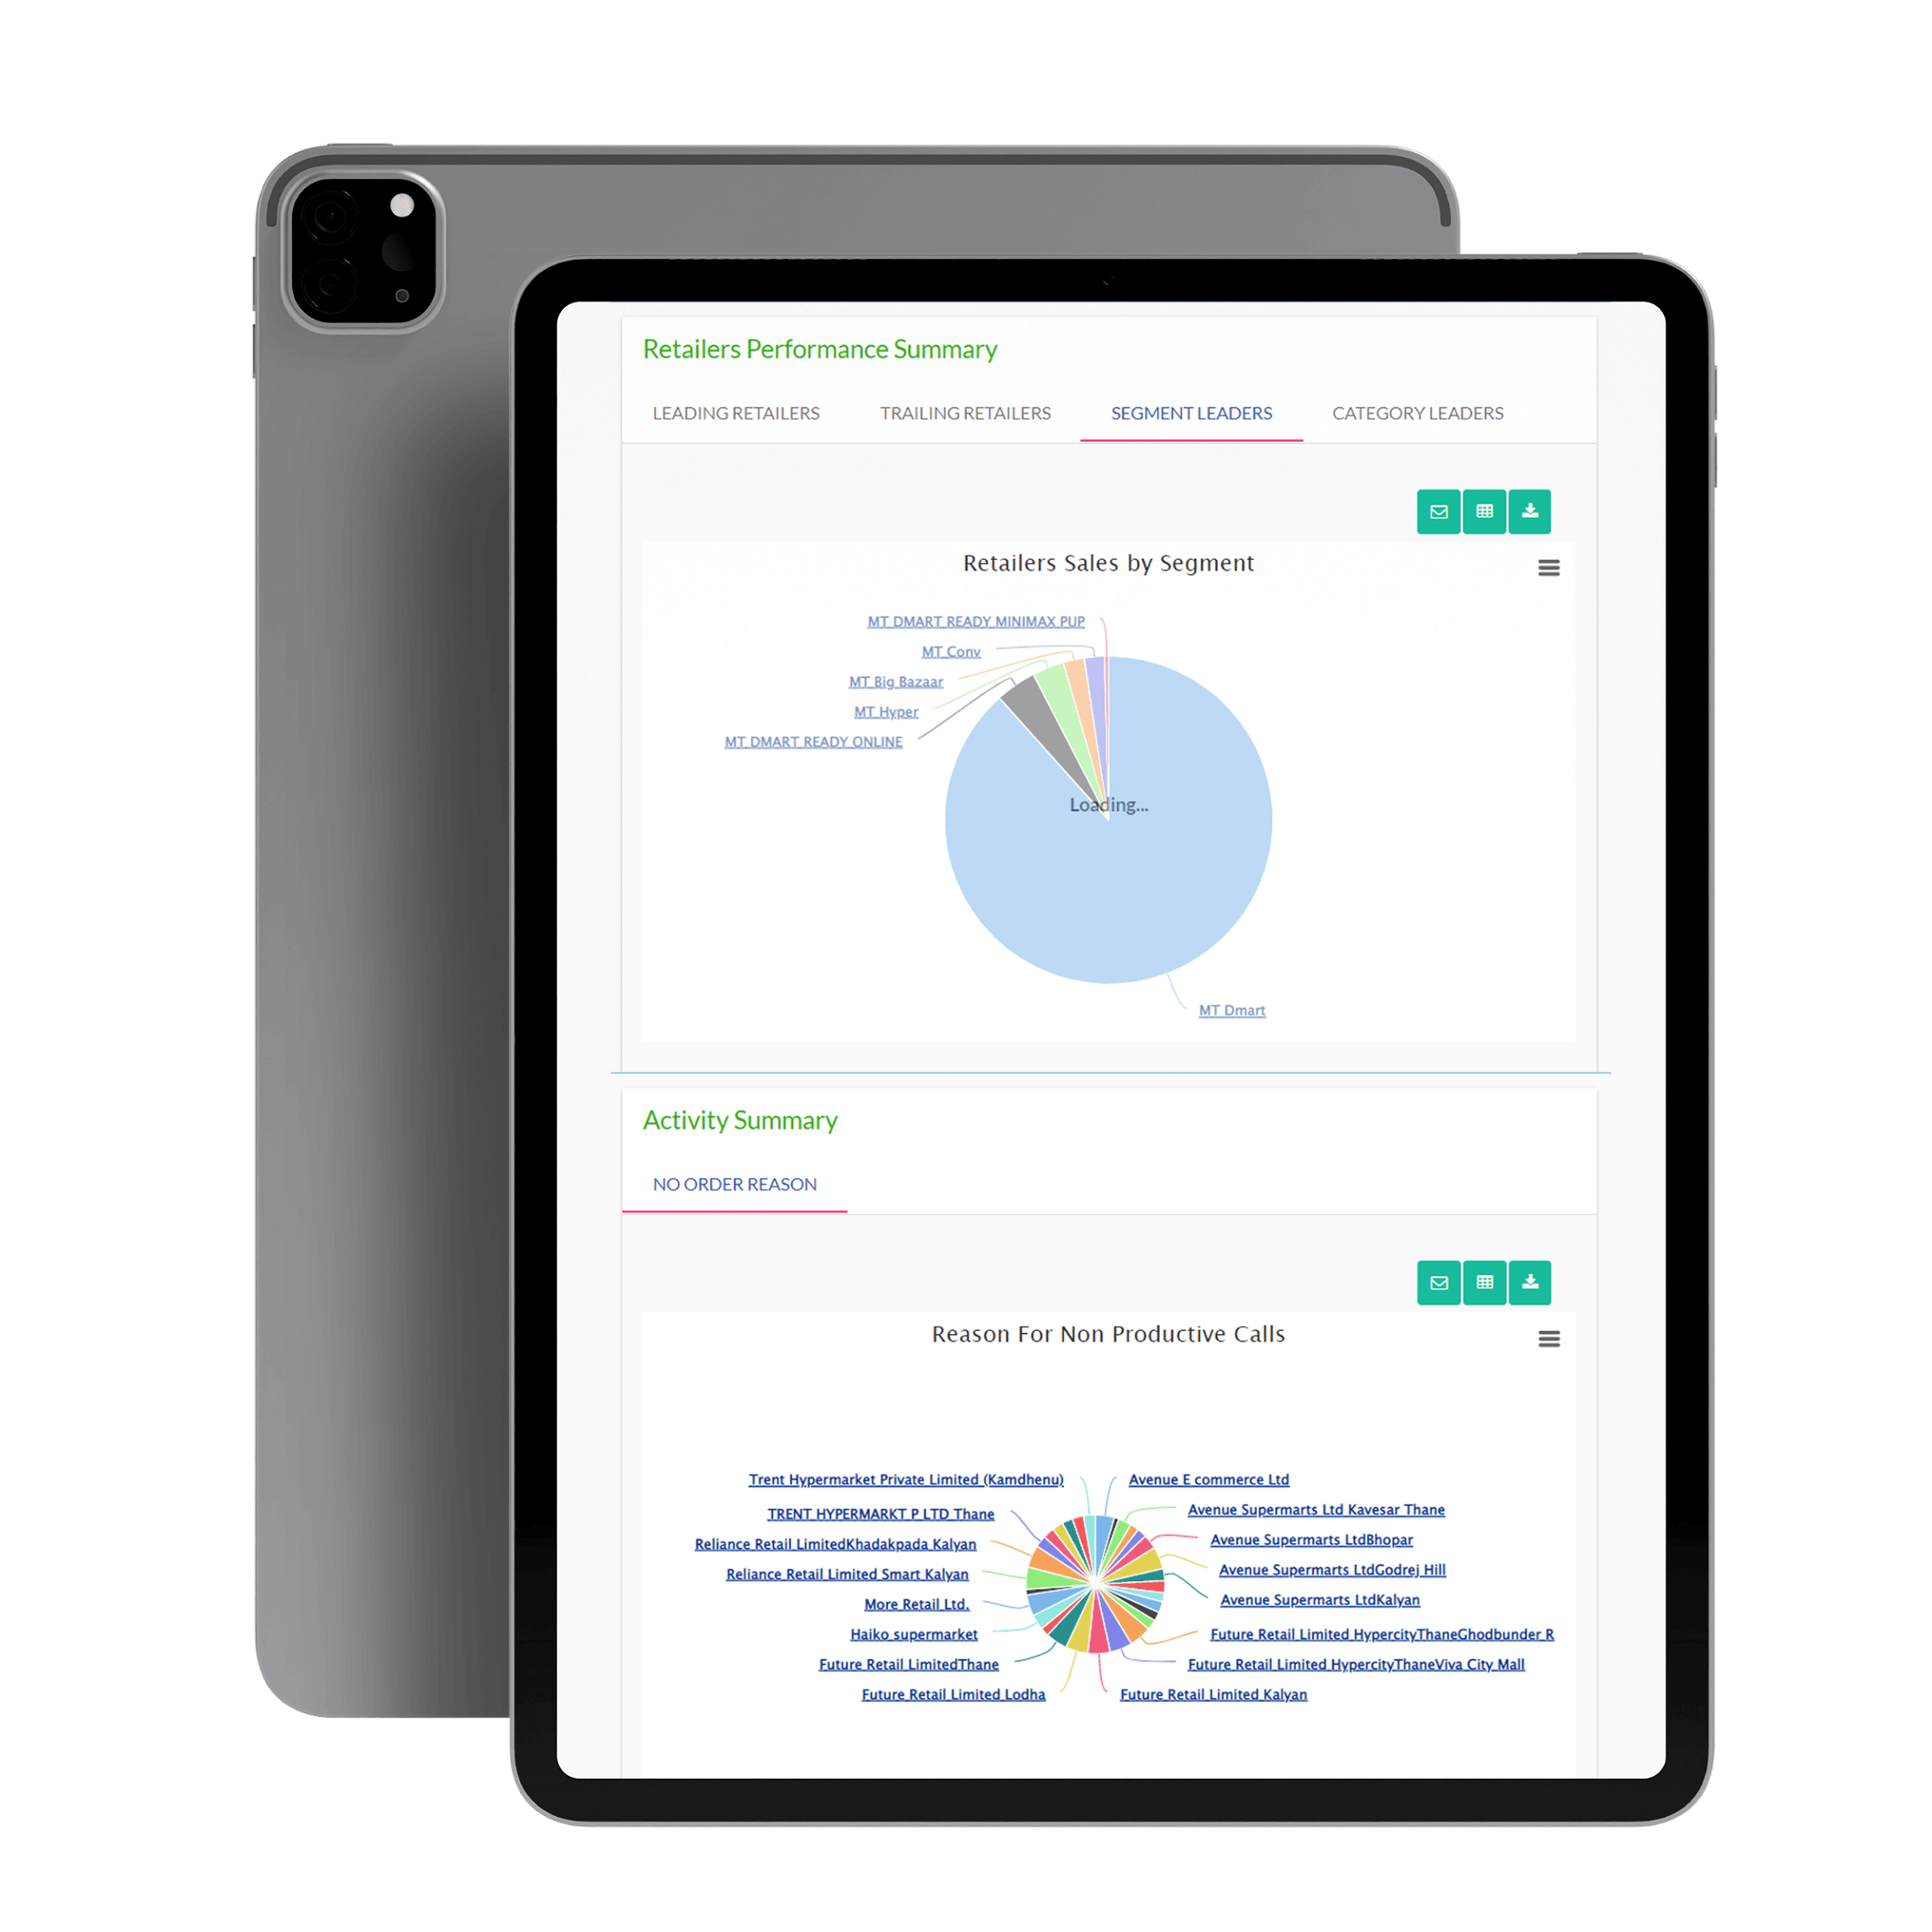
Our Ivy Insights solution delivers clear, crisp, and actionable intelligence to consumer goods companies by real-time data integration and analysis. Customize the solution for your business or use our pre-built dashboards and reports, specially made for consumer goods companies.
Empower people at all skill levels to make informed decisions
Best-in-class interactive experience
Unmatched performance, scalability, and flexibility
Sophisticated alerts to proactively monitor business and take timely action
Seamlessly integrate across our solutions or any other solutions
Dynamic Dashboards
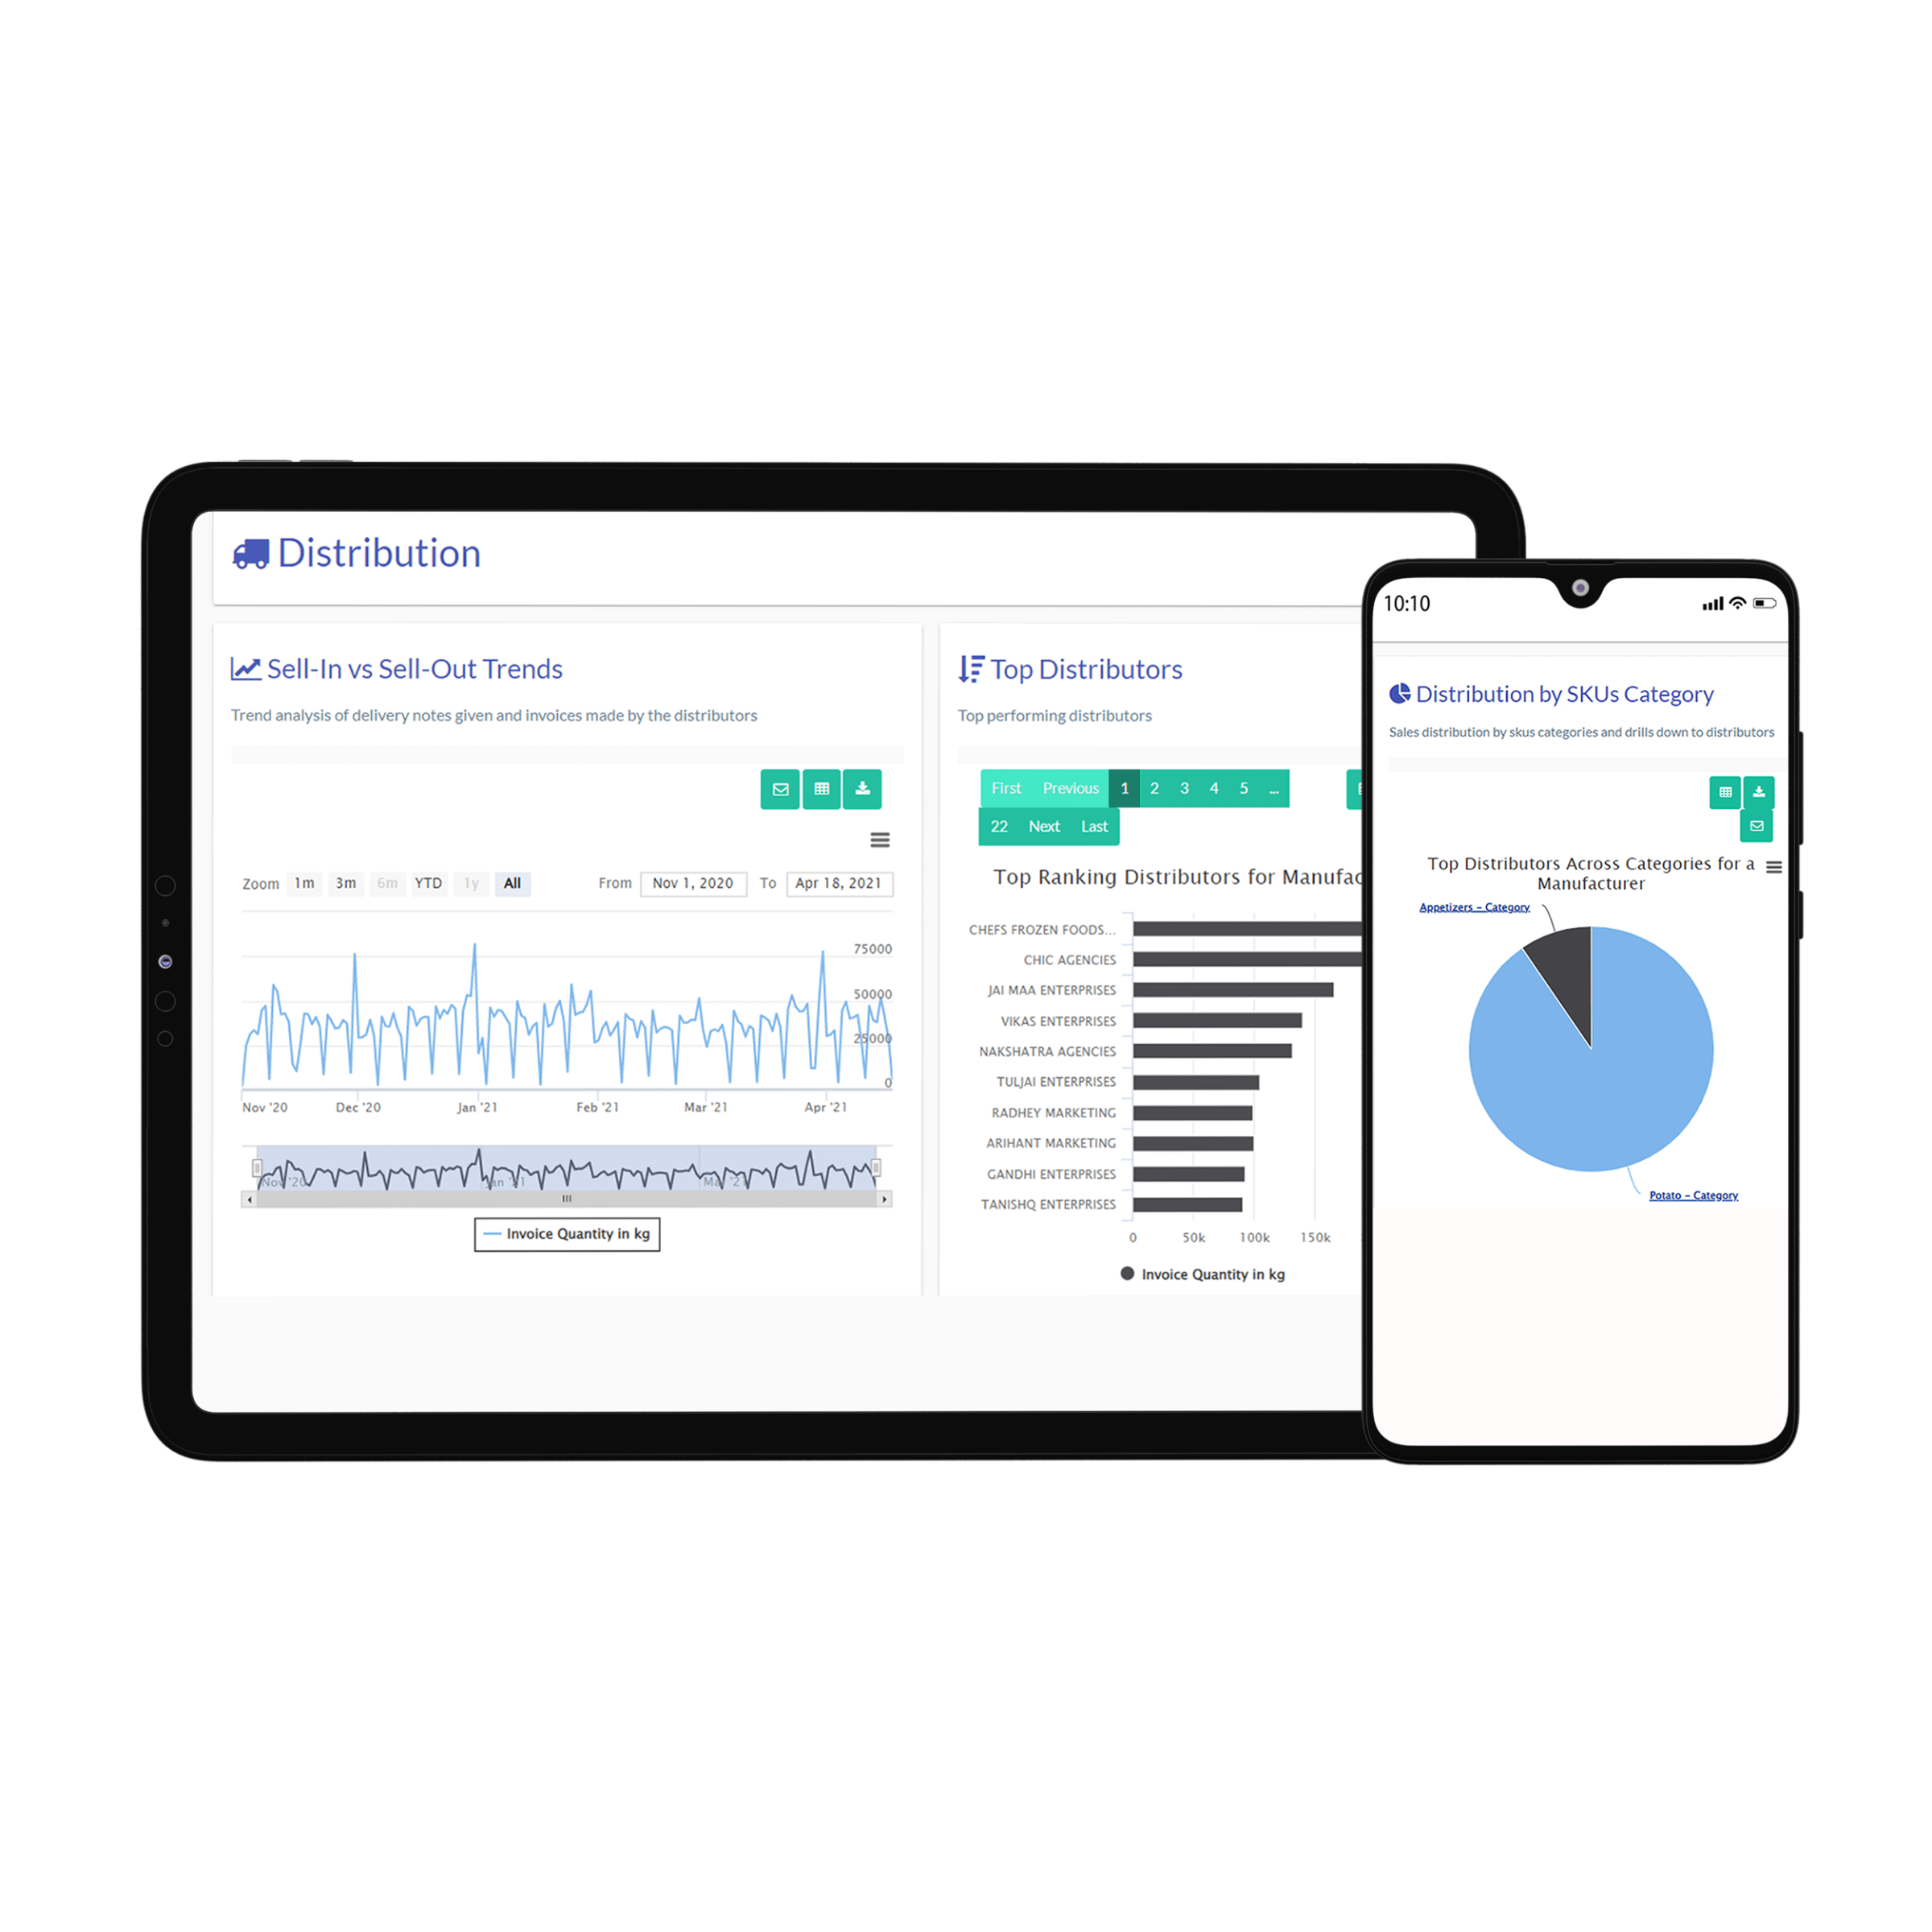
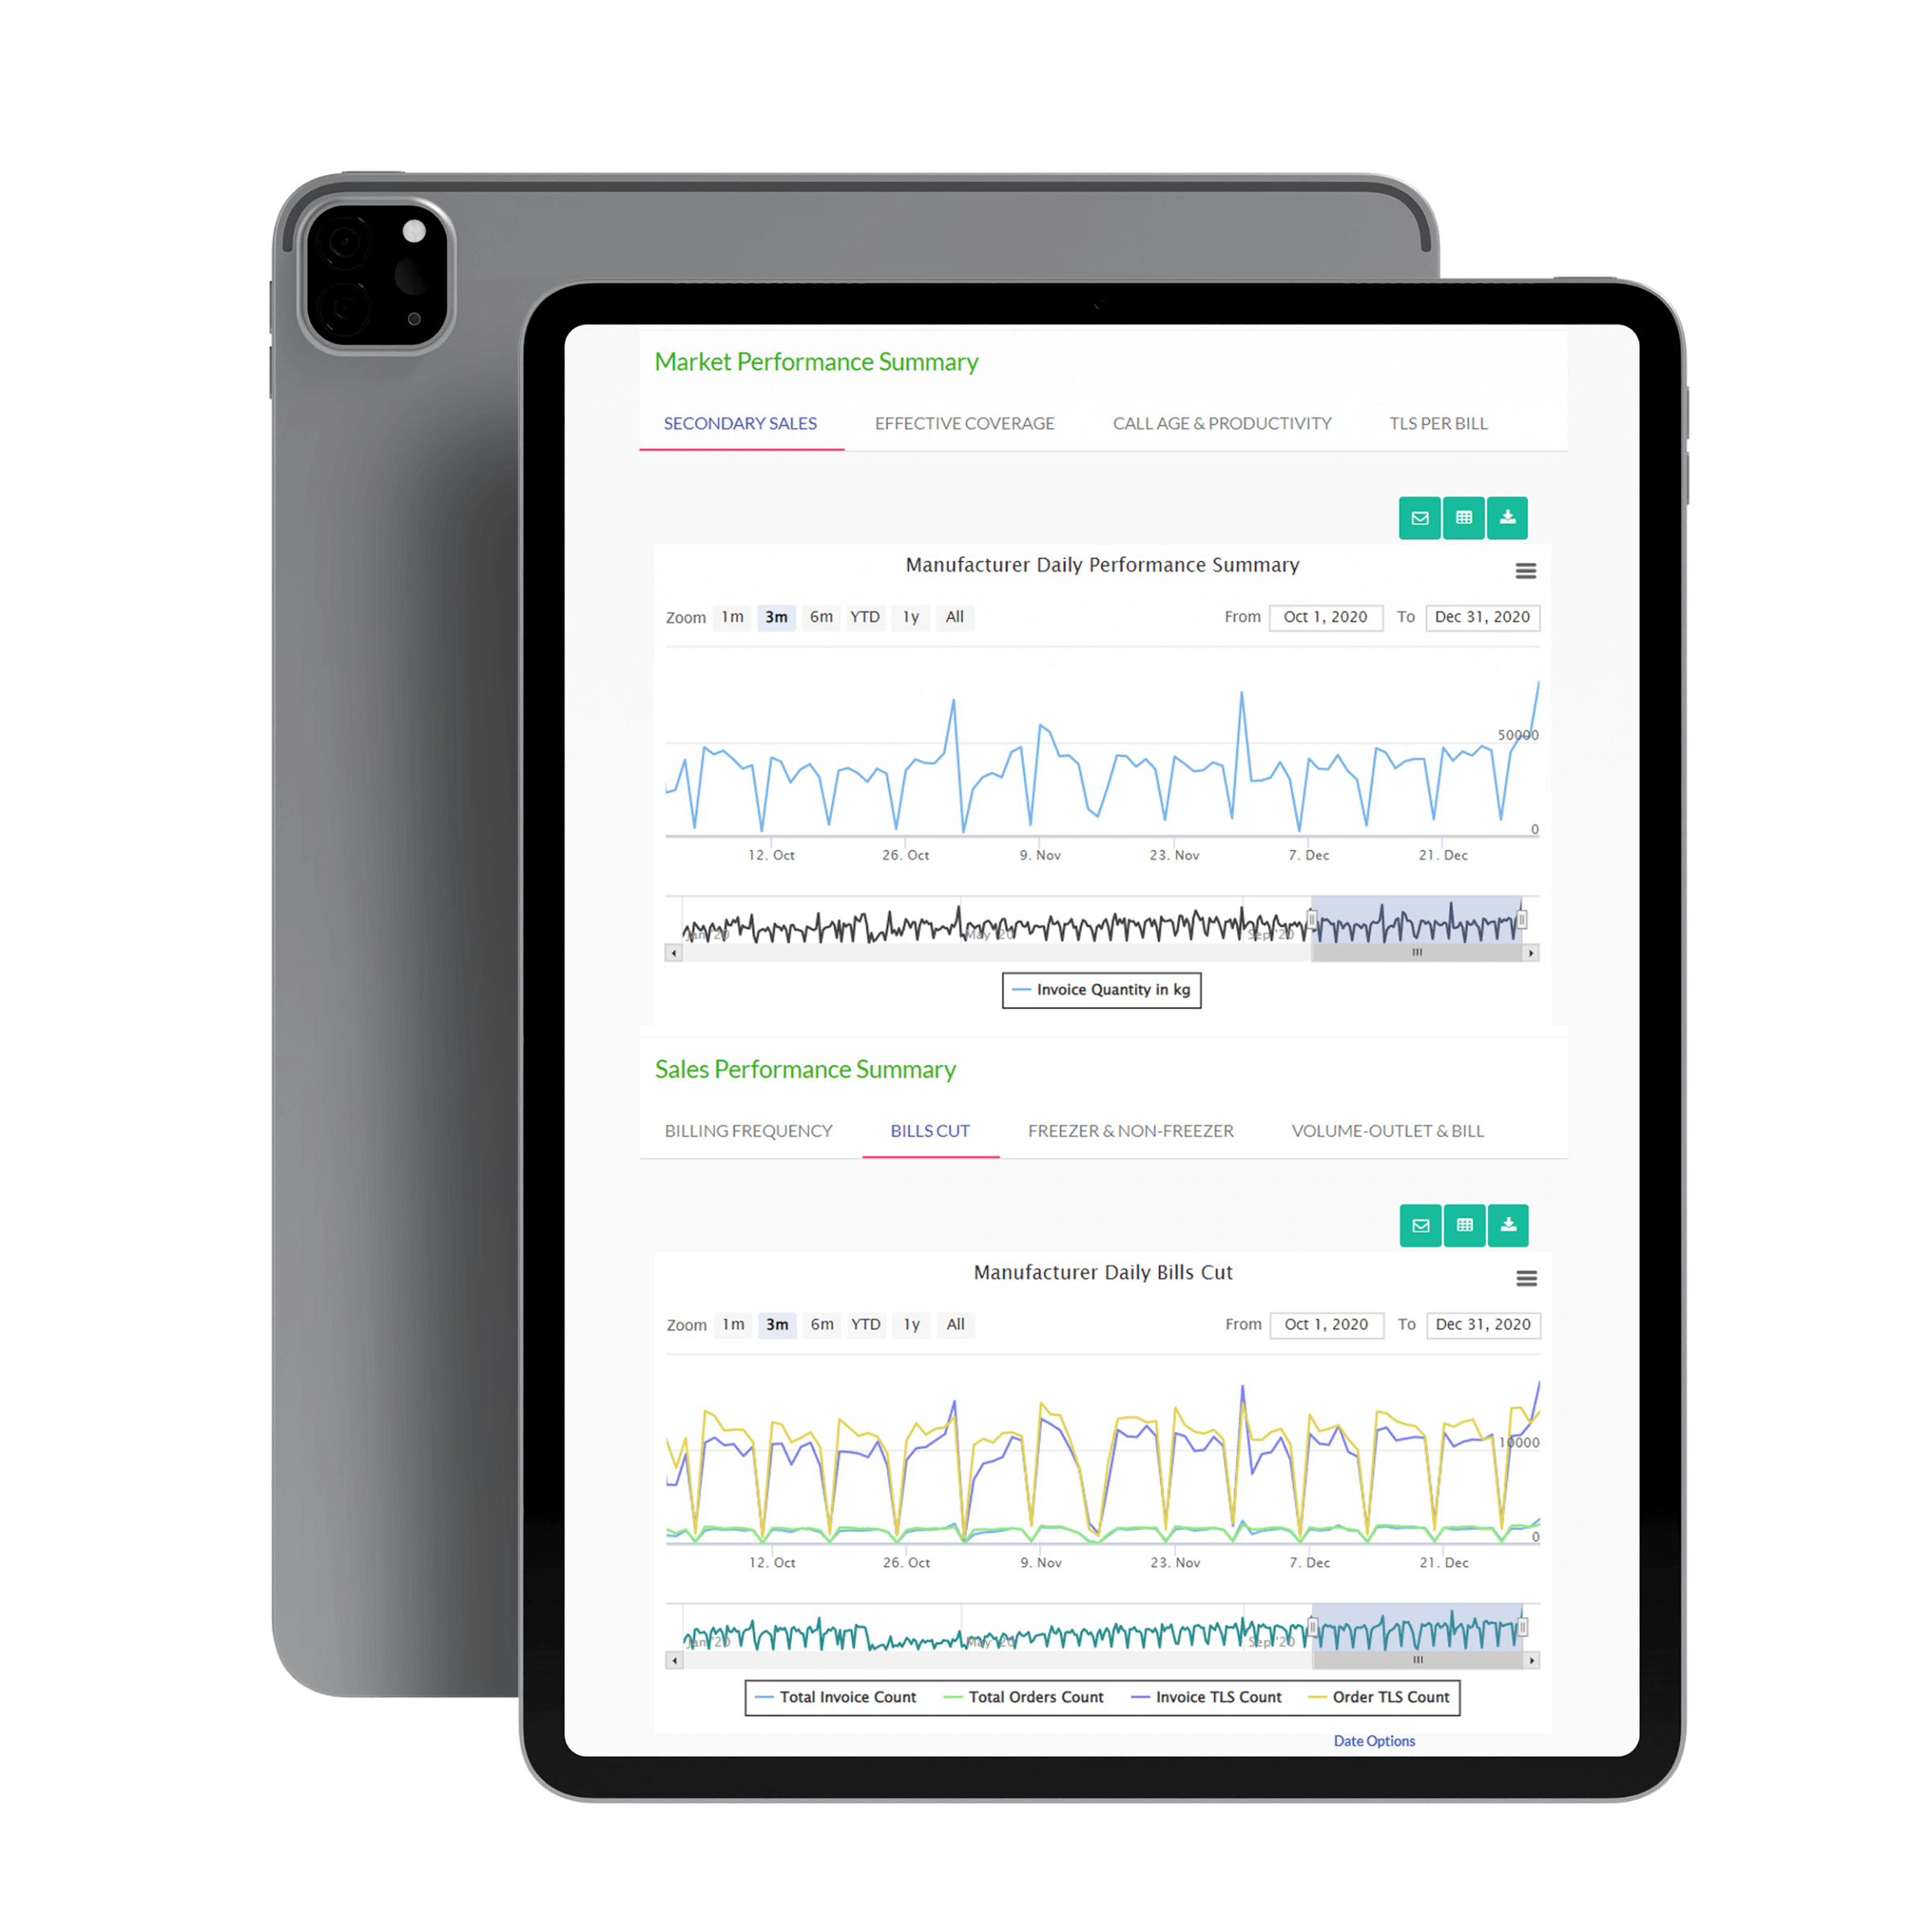
- Slice and dice your data on market summary, daily or monthly sales volumes
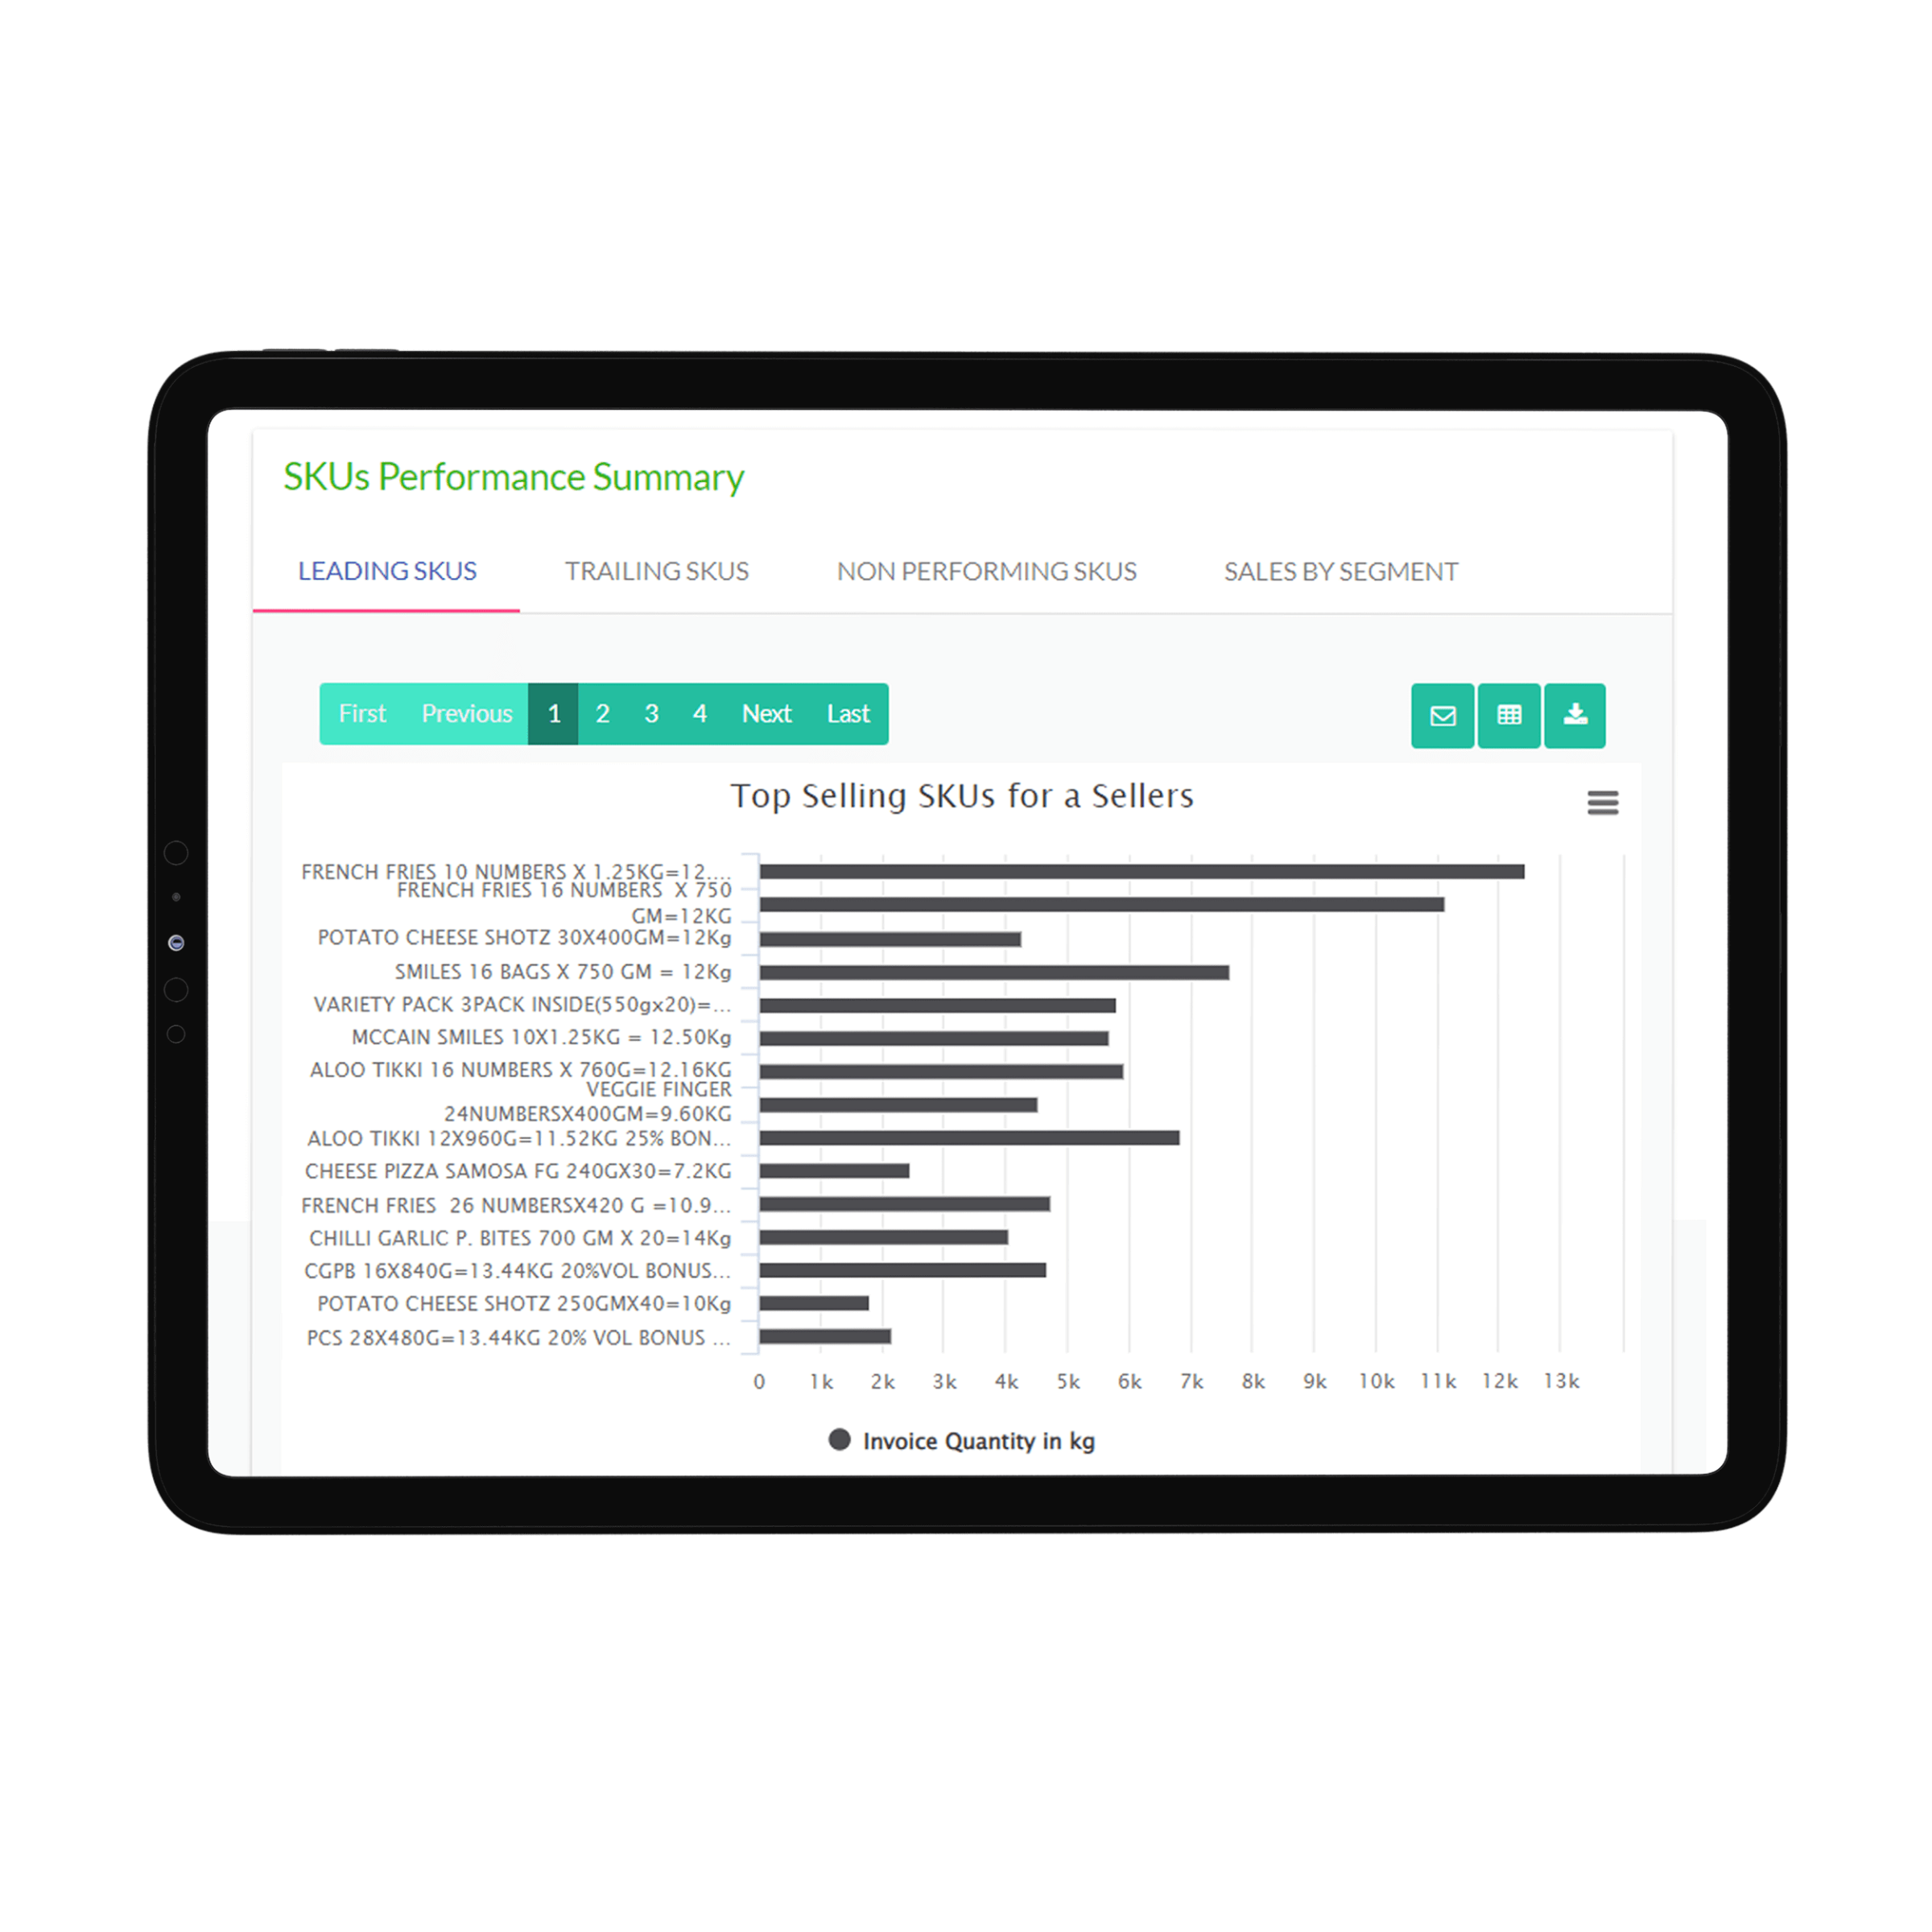
- Analyze top SKUs, brand distribution, and more across different markets
- Easy-to-view parameters, quick filtering options, and dimensional hierarchies
Configuration
- With our set of open APIs, Ivy Insights is fully configurable
- Meet complex reporting requirements of your business
- Create new visualizations, build reports or integrate with other solutions
Insights Generation using Next-Generational Artificial Intelligence algorithms
- Receive relevant, plausible, and understandable insights generated by our AI/ ML engine
- Analyze years of data to predict future trends, identify tactics that work or patterns that emerge
- Enable your teams to make informed choices
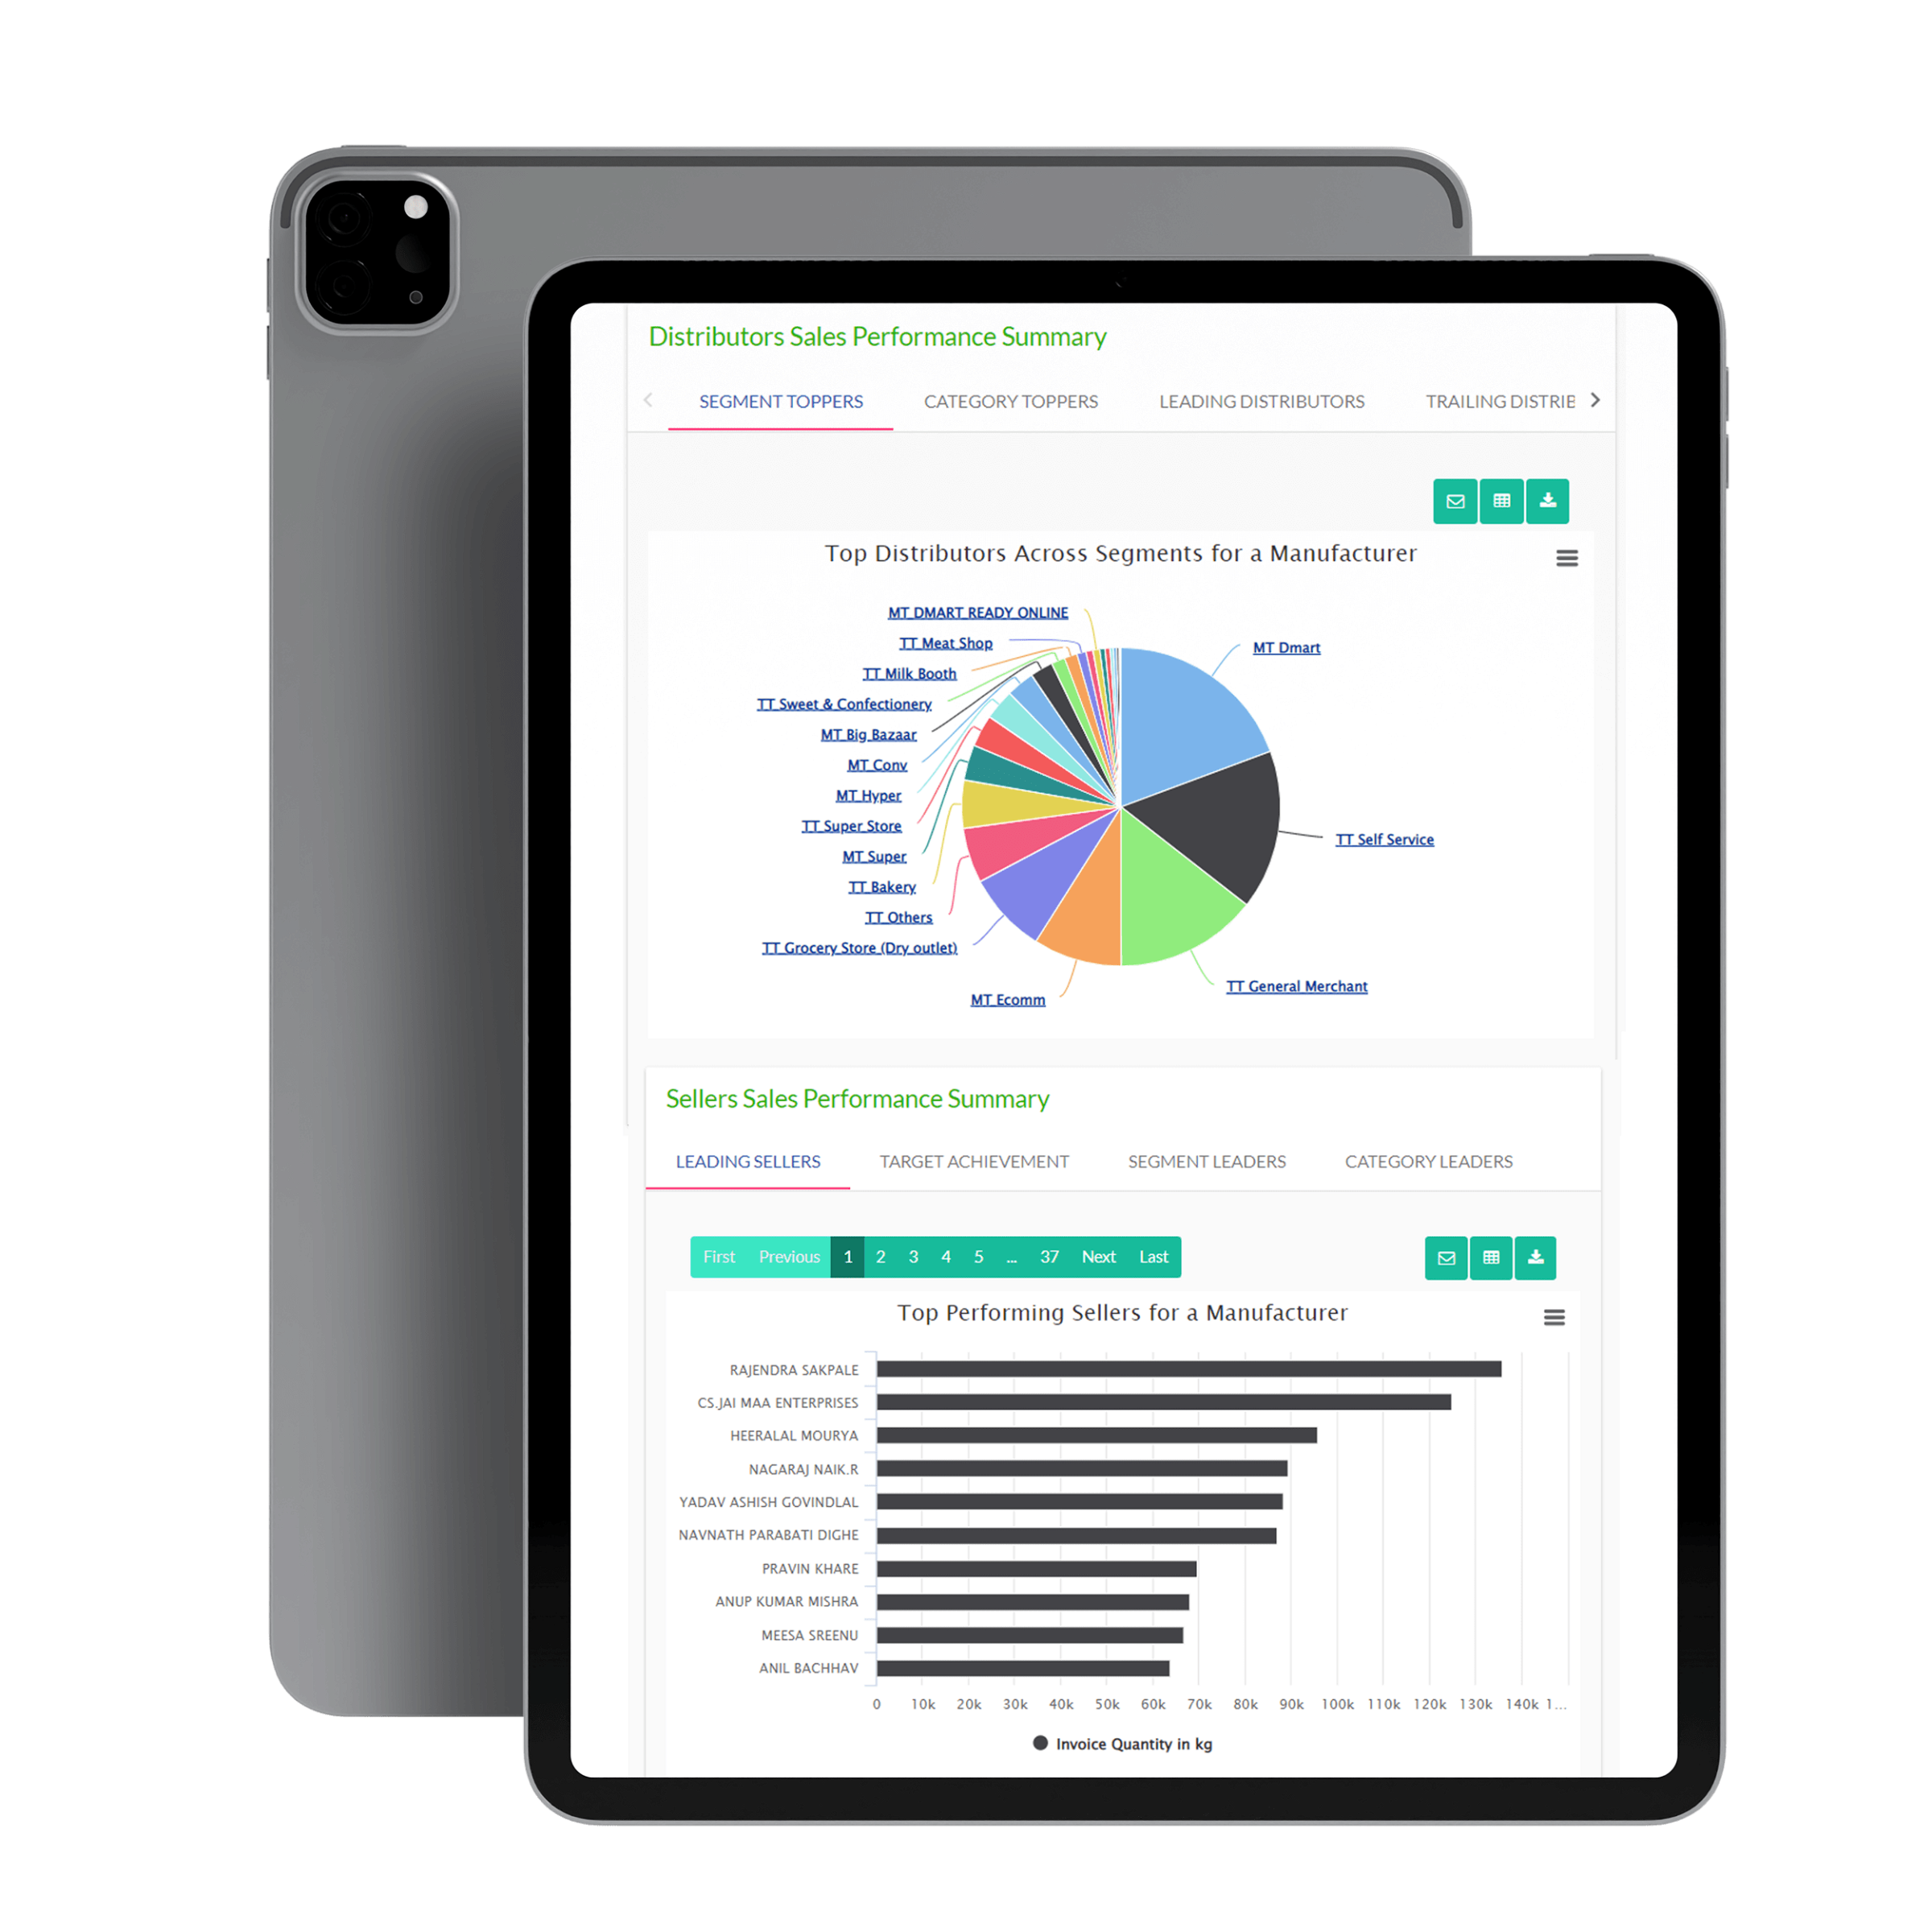
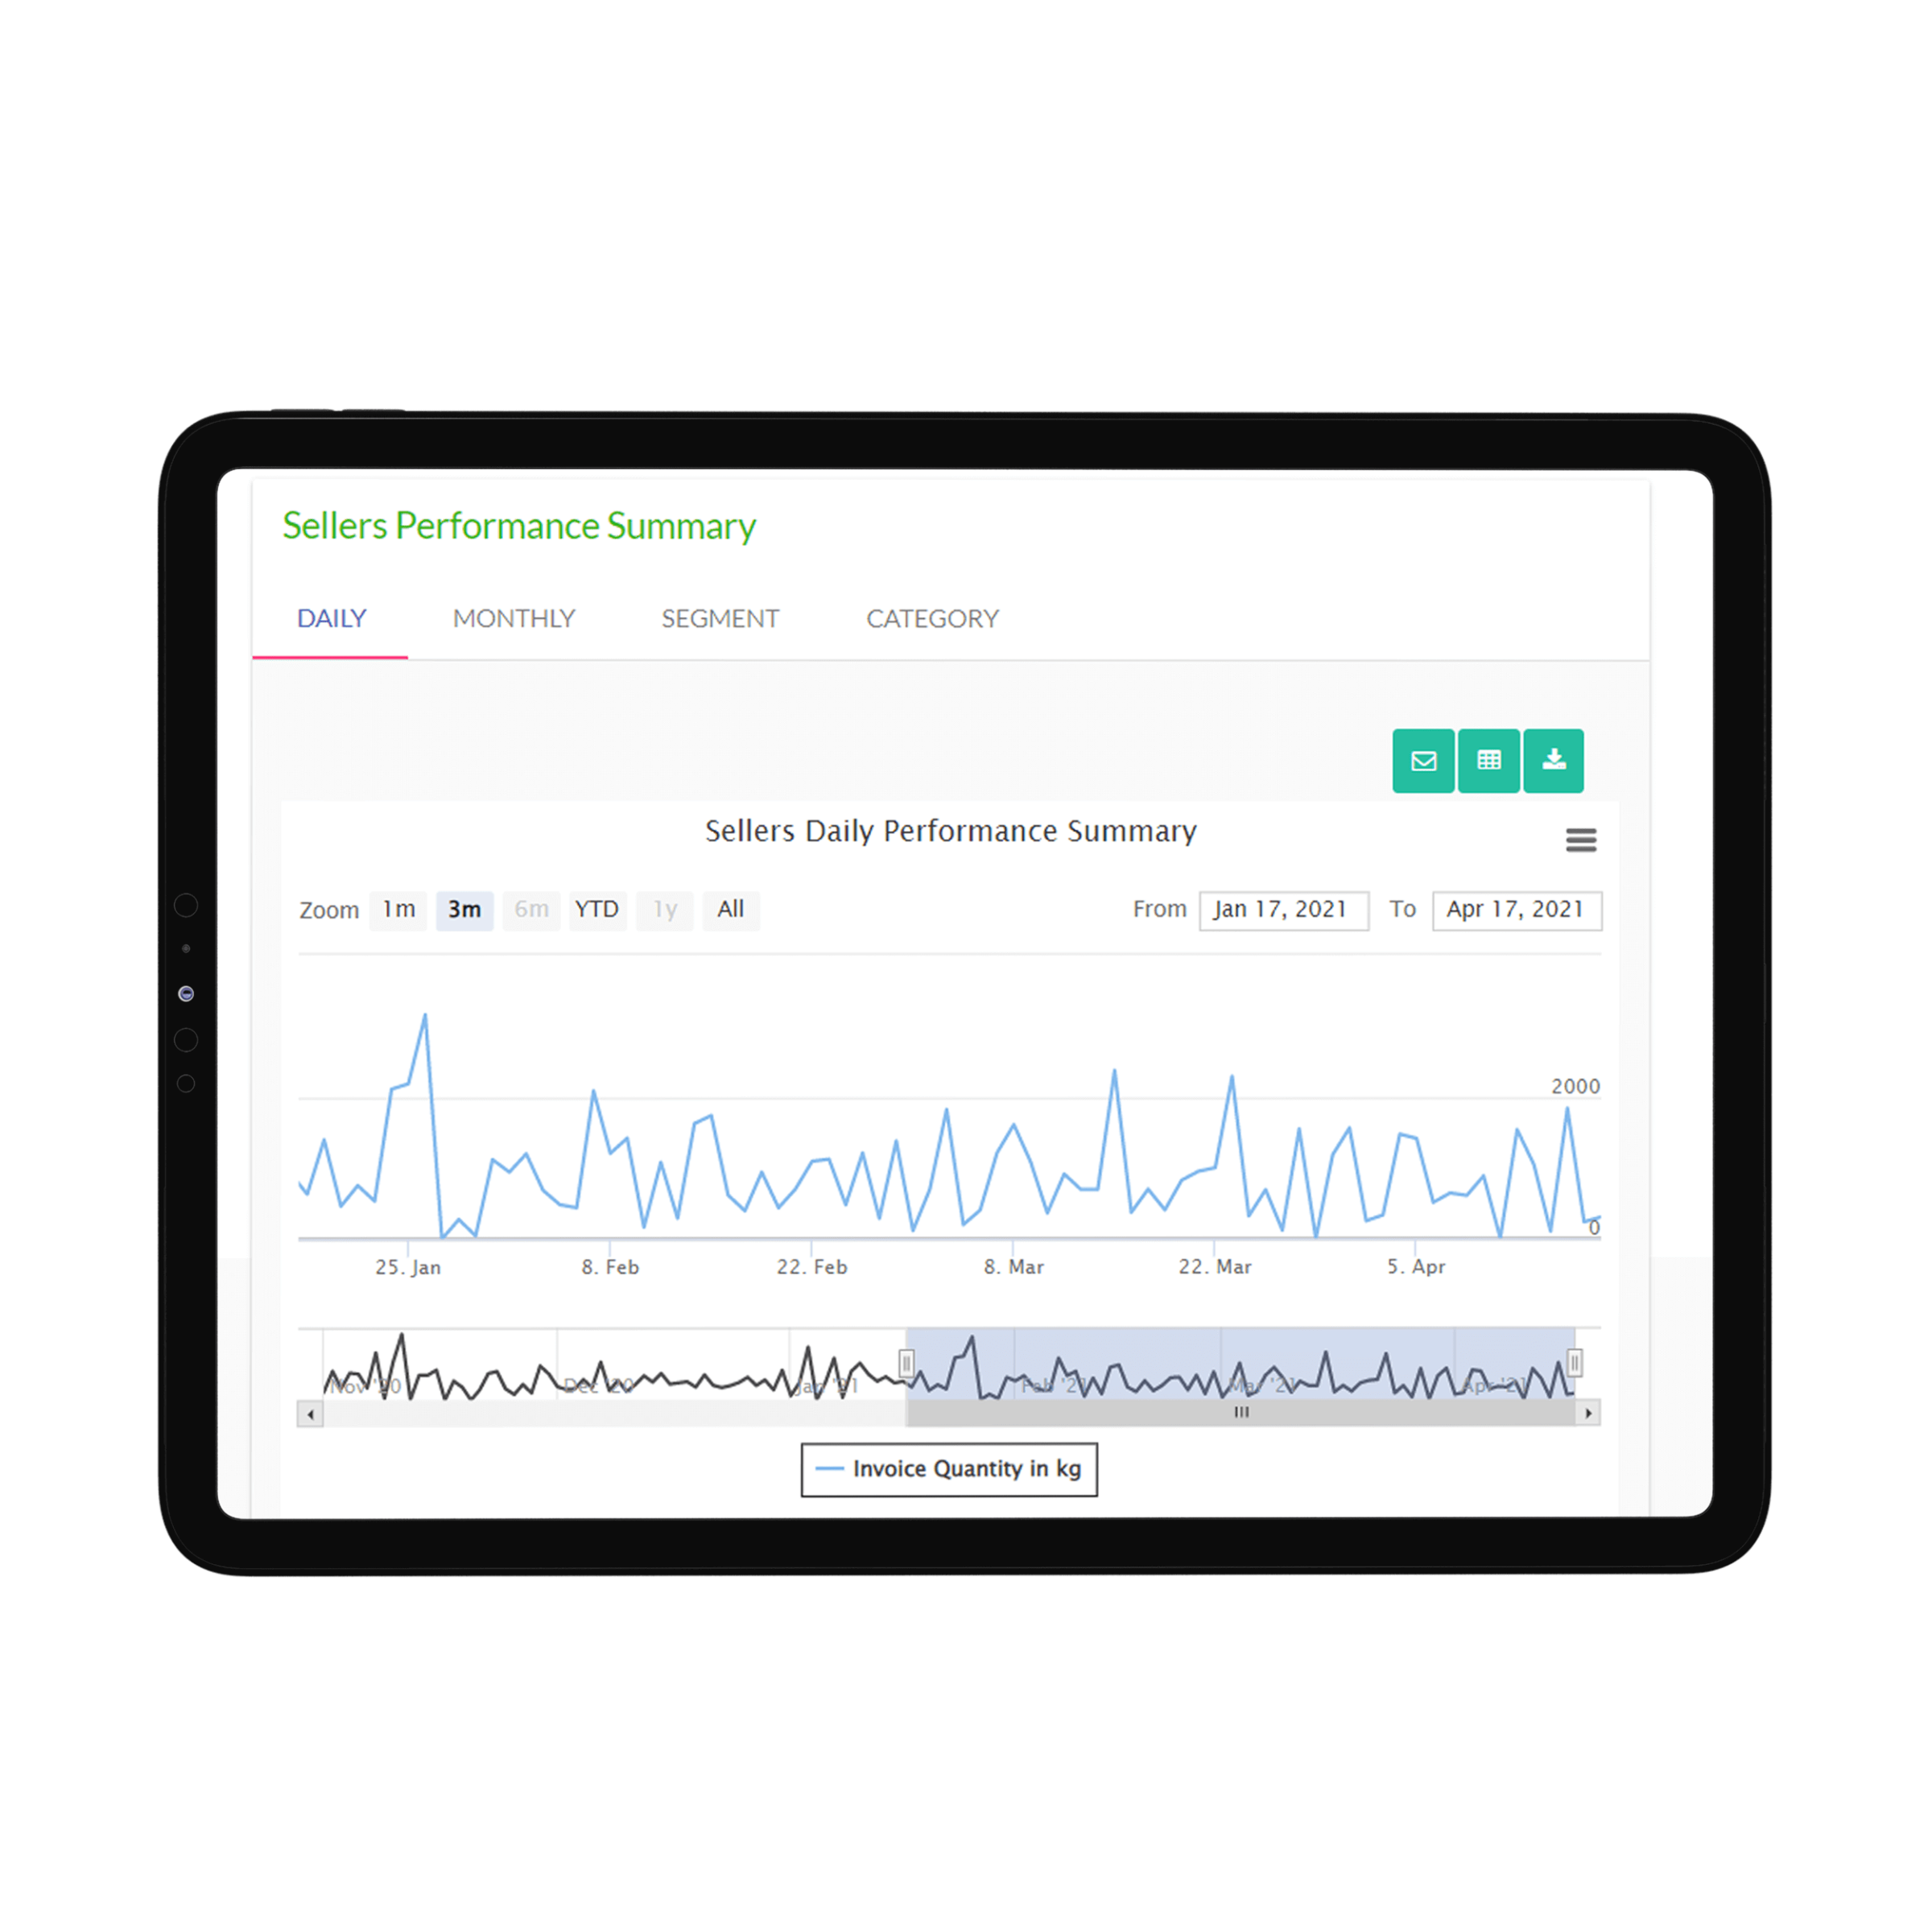
Standard and Custom Reports
- Use our pre-built reports or have custom reporting created for your business
- Reports can be published, subscribed or shared easily in various formats
- Highly flexible design and formatting options to match your branding needs
Complexity based visualizations
- Simplify the data deluge with our complexity-based visualizations
- Tier I visualizations hold simple data, and Tier II analyzes historical data
- Complex and multi-parametric data that depends on several factors belong to the Tier III
Data Access Control
- Restrict access to data for users to go as deep as at the field level
- Authorize specific users or groups of users or third parties to access your data
- Meet the security, privacy, and compliance requirements of your business
